Trump Just Exposed The True Enemy, Did Trump Just Signal That He Is In Full Control? – Ep. 3879
Watch The X22 Report On Video

![Ep 3879a - The Drama About Rising Gas Price Is Just That, Drama, The [CB]s Have Lost Control](https://x22report.com/wp-content/uploads/2026/04/rumble_financial_map-300x169.jpg)
Trump is now dismantling the [CB] system that was put into place across the globe to support the federal reserve note. Trump is in the process of preparing the stage to remove the [CB]. The gas price drama is just that, gas prices are lower when you look at Biden and Obama, the fake news are using to it convince that its worse.As soon the cease fire was announced oil dropped like a rock. The [DS] is panicking, Trump is gaining leverage over Iran, they never thought this would be possible. Trump is exposing the true enemy and isolating them. Trump is building leverage because he is meeting Xi in May. Trump has just showed the [DS] players that the new regime is gaining more power and control. By opening the strait this sends a clear message. Trump sent a message to Obama, Obama took a pic with a white rabbit and Trump took a pic with a brown rabbit.
Economy
- While the U.S. military action in Iran has been a source of many benefits to the U.S., a collateral negative effect has been the increase in world oil prices, and the associated increase in gas prices at the pump for U.S. consumers. An analysis of the increase in gas prices in the context of U.S. gas prices during the past two decades would allow for a more informed and rational discussion of the pros and cons of this Iran conflict.
- The figure above illustrates U.S. gas prices 2000-2026. During the Obama administration, gas prices quickly increased to $4 and generally stayed between $3 and $4 for most of his term. During Trump 1.0, gas prices mostly stayed between $2 and $3. During the Biden administration, gas prices quickly rose to about $5 and then declined to about $3. During Trump 2.0, gas prices mostly declined, with the exception of March 2026 when prices increased to about $4.
- Average gas prices during Trump 1.0 were about 16% ($0.49 per gallon) less than under Obama. Average gas prices during Trump 2.0 have been about 10% ($0.34 per gallon) less than during the Biden administration.
- Due to inflation, a dollar in 2010 was worth more (in terms of goods and services that dollar could purchase) than a dollar in 2020, which was worth more than a dollar today.
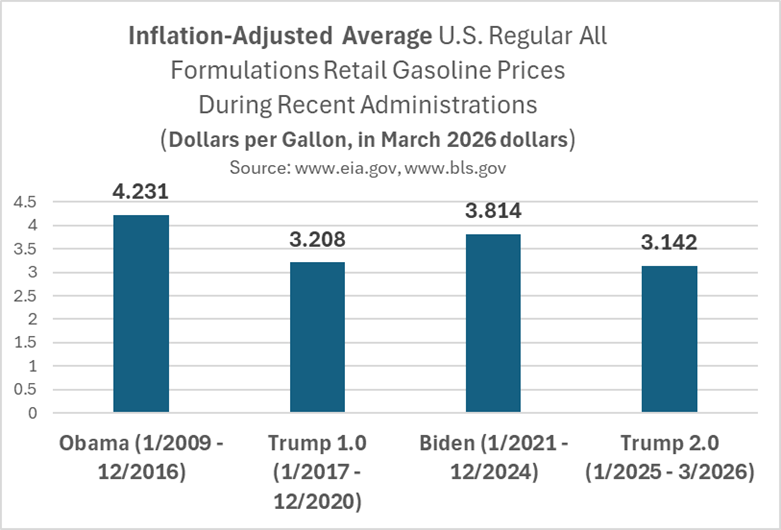
- inflation-adjusted average gasoline prices during recent U.S. administrations. Inflation-adjusted average gas prices during Trump 1.0 were about 24% ($1.20 per gallon) less than under Obama. Inflation-adjusted average gas prices during Trump 2.0 have been about 18% ($0.67 per gallon) less than during the Biden administration.
- Average gas prices during the current Trump administration are about $0.34 per gallon less than during the Biden administration. Inflation-adjusted average gas prices during the current Trump administration are about $0.67 per gallon less than during the Biden administration.
Source: dailysignal.com
WAR: Oil prices are crashing. If Trump was trying to spike oil prices he’s failing. Help us! https://t.co/qZQ6gkDKtY pic.twitter.com/zBGH3dp6DG
— @amuse (@amuse) April 8, 2026
We always hear that Social Security is about to run out of money.
How come we never hear that foreign aid is about to run out of money?
Why do all of the federal programs with massive fraud never run out of money? https://t.co/nvkOb1qciO
— Based Jessica (@RealJessica) April 8, 2026
Geopolitical
It’s a Marxist humiliation ritual. Full stop.
They pulled him from his daughters too. They want every veteran’s daughter to wonder if their dad will be next. To ask themselves “is dad really my hero?”
If you haven’t yet realized this is a war against Christian families then you… https://t.co/lXw8qmFDHk
— John Ʌ Konrad V (@johnkonrad) April 8, 2026
need to catch up. Go read what Moa and Stalin did to humiliate families.
Free Speech is a weapon of war.
It is the most powerful weapon that free people have against tyrants.
Tyranny is so fragile, that words of truth can tear it down.
Free speech is a weapon of rebellion and resistance.
Rebel with me. pic.twitter.com/tTtks9Fj1X
— William Wallace Welker (@Will_W_Welker) April 4, 2026
🚨 She didn’t misspeak… she MEANT this.
A Democrat running for office in Georgia just said Trump voters should be PUNISHED by losing their internet access for FOUR YEARS.
Meet Suzanna Karatassos.
This isn’t a joke. It’s not taken out of context … She said it!
They don’t… pic.twitter.com/xplcr5o6HT
— Sherri Unfiltered™ (@FFT1776) April 7, 2026
to debate you. They don’t want to persuade you. They want to silence you. That’s not democracy. That’s control. This is exactly why passing the SAVE America Act is so important … They will RIG ELECTIONS and install this BS! Watch her own words … then ask yourself: If they could shut you up tomorrow, do you think they wouldn’t?

WATCH: JD Vance said he was unaware until recently that Zelenskyy had allegedly suggested sending private soldiers to the residence of Viktor Orbán.
"I almost couldn’t believe it’s true, but it’s true. It’s completely scandalous." pic.twitter.com/tYrP9lf7Dt
— Election Wizard (@ElectionWiz) April 8, 2026
- The Justice Department and FBI said they carried out a court-authorized operation to shut down a Russian military intelligence network that had been using compromised internet routers inside the United States as a platform to intercept sensitive data.
- Officials tied the activity to GRU Unit 26165, also known as APT28, which exploited known vulnerabilities in widely used routers and altered their settings to redirect internet traffic through infrastructure it controlled. That access did not depend on hacking individual computers. By taking over the router, operators placed themselves in the path of the data and monitored traffic moving across the network to decide what to extract.
- For selected targets, the network returned fraudulent DNS records that mimicked legitimate login services, including Microsoft Outlook Web Access, to capture passwords, authentication tokens, and email data.
Today the FBI and @TheJusticeDept announced Operation Masquerade, a court-authorized technical disruption of Russian GRU infrastructure used to steal government, military, and critical infrastructure information.
Since at least 2024, a cyber unit within Russian military… pic.twitter.com/r8LWbZrfQs
— FBI Cyber Division (@FBICyberDiv) April 7, 2026
Source: redstate.com
War/Peace
exceeded all Military objectives, and are very far along with a definitive Agreement concerning Longterm PEACE with Iran, and PEACE in the Middle East. We received a 10 point proposal from Iran, and believe it is a workable basis on which to negotiate. Almost all of the various points of past contention have been agreed to between the United States and Iran, but a two week period will allow the Agreement to be finalized and consummated. On behalf of the United States of America, as President, and also representing the Countries of the Middle East, it is an Honor to have this Longterm problem close to resolution. Thank you for your attention to this matter! President DONALD J. TRUMP
With the greatest humility, I am pleased to announce that the Islamic Republic of Iran and the United States of America, along with their allies, have agreed to an immediate ceasefire everywhere including Lebanon and elsewhere, EFFECTIVE IMMEDIATELY.
I warmly welcome the…— Shehbaz Sharif (@CMShehbaz) April 7, 2026
sagacious gesture and extend deepest gratitude to the leadership of both the countries and invite their delegations to Islamabad on Friday, 10th April 2026, to further negotiate for a conclusive agreement to settle all disputes. Both parties have displayed remarkable wisdom and understanding and have remained constructively engaged in furthering the cause of peace and stability. We earnestly hope, that the ‘Islamabad Talks’ succeed in achieving sustainable peace and wish to share more good news in coming days!
Benjamin Netanyahu rejects President Trump’s ceasefire and says the war will continue against Iran at any time he chooses.
Netanyahu says he will achieve his objectives through further military action under his command.
“We are ready to resume the fighting at any moment.”
“Our… pic.twitter.com/lsYoXVO4gb
— Shadow of Ezra (@ShadowofEzra) April 8, 2026
good cop, bad cop
Pentagon says ceasefire does not apply to Hezbollah and they won’t be involved in Israel vs Lebanon conflicts saying it’s a regional matter.
— 0HOUR1 (@0hour1) April 8, 2026
- US position (Trump, White House, Pentagon): Explicitly not included. Trump told PBS: “Because of Hezbollah, they were not included in the deal. That’ll get taken care of too. It’s alright… It’s a separate skirmish.” White House spokesperson Karoline Leavitt and Pentagon briefings (e.g., by Defense Secretary Pete Hegseth) confirmed the same: the ceasefire is strictly between the US and Iran on direct hostilities; Israel-Lebanon/Hezbollah is a separate regional matter.
- The US and Israel (the parties whose statements the Pentagon post references) treat Hezbollah/Lebanon as outside the deal. Iran/Pakistan view it as covered under the broader “regional” language in Iran’s 10-point plan. This ambiguity has already led to immediate tensions, with Israeli strikes ongoing in Lebanon and Iran threatening responses.
I think I may need to explain what a "ceasefire" means in political terms.
It means that the parties will stop shooting at each other to give time to come to a peace agreement. When a ceasefire is declared, NOTHING is agreed to other than the ceasefire itself. The ceasefire is…
— Cynical Publius (@CynicalPublius) April 8, 2026
for a specified period of time, and if an agreement cannot be achieved in that time, then once again it’s bombs away (or the parties agree to extend the ceasefire). In business terms, it’s kind of like a “no shop” clause in an acquisition term sheet–the seller agrees that it will deal only with the prospective buyer for a specified period of time, but once that time is over, the seller can once again deal with anybody.
FAKE NEWS 🚨 CNN's 10 point plan peace plan is 100% fake, phony and false!
CNN has already taken down their fake story.
Anyone sharing this is a dishonest hack. @CNN should be sued into oblivion by the DOJ for knowingly sharing a fake peace proposal! pic.twitter.com/gqTu3gQyGV— J (@JayTC53) April 8, 2026
immediately withdraw this Statement with full apologies for their, as usual, terrible “reporting.” Results of the investigation will be announced in the near future. President DONALD J. TRUM
One might argue, that this little stunt pulled by CNN, could be considered aiding and abetting the enemy during wartime, aka, TREASON!
We have been so desensitized to the media being an enemy of the People, but this is insanity.
This wasn’t an accident. CNN tried to sabotage… pic.twitter.com/owOy5zTEe1
— Clandestine (@WarClandestine) April 8, 2026
Trump’s peace plan and are spreading Iranian propaganda, with the intent to prevent the public from celebrating Trump’s great accomplishment. This is proof that the Left-wing MSM are truly allied with the enemy. Co-conspirators. Treason.
to a CEASEFIRE. It is something that is reasonable, and can easily be dispensed with. It’s very much like Fake News CNN last night, headlining a “source” that had no power or authority to write a Letter claiming great authority. President DONALD J. TRUMP
. Two Democratic-leaning New York newspapers—the New York World and the New York Journal of Commerce—published a forged presidential proclamation. It falsely claimed that Lincoln was calling for a national day of fasting and immediately drafting 400,000 more Union soldiers (a number higher than any actual call at the time). The story was a complete hoax, fabricated by a journalist named Joseph Howard Jr. (along with an accomplice) to manipulate the gold market for personal profit.
Lincoln reacted swiftly and personally. He signed an executive order directing Major-General John A. Dix in New York to arrest the editors, proprietors, and publishers of both papers, seize their printing offices by military force, and hold the men in close custody until they could face a military commission. The order explicitly described the publication as “wickedly and traitorously” printed, a “false and spurious proclamation” of “treasonable nature” designed to aid the enemy.
U.S. troops marched into the newspaper offices in lower Manhattan that same morning, pointed guns at staff, shut down the papers, and imprisoned the editors and publishers without immediate trial (habeas corpus had been suspended). The papers remained closed for several days until the hoax was fully exposed and the real culprit (Howard) was arrested. The editors were eventually released without formal charges, and the newspapers resumed publication—but Lincoln’s order had been carried out exactly as described.
Iran signed a ceasefire last night and broke it before most Americans finished breakfast.
But that’s not the story.
The story is what Trump did while everyone was staring at the missiles.
The sequence: Iran signs ceasefire. Iran releases fake version claiming total victory.…
— Jesús Enrique Rosas – The Body Language Guy (@Knesix) April 8, 2026
CNN runs fake version as real news. Trump calls it fraud. Iran launches missiles at Israel, Kuwait, UAE, and Bahrain. Ceasefire lasts fewer hours than a domestic flight. Everyone is asking the wrong question.
The question isn’t “why did Iran break the ceasefire.” The answer to that is obvious.
Iran has a political wing that wants to negotiate and a military wing that wants to die fighting. The IRGC operates 32 independent regional commands.
The politicians signed the paper.
The generals launched the missiles. Iran is a country negotiating with itself at gunpoint.
Trump already knows this. This morning he posted that Iran has gone through “a very productive regime change.”
He’s not angry about the broken ceasefire
. He’s looking past the IRGC and talking directly to the political faction that’s still alive and desperate. Then, minutes later, he posted a 50 percent tariff on any country supplying weapons to Iran. He didn’t name China.
He didn’t have to. Five Iranian ships left a Chinese port carrying sodium perchlorate, the chemical you need to make the solid rocket fuel inside every missile that just hit Kuwait.
China trades $500 billion a year with the US. Russia trades under $500 million. The tariff isn’t about Russia. So: one hand offers Iran reconstruction money and sanctions relief. The other hand prices China out of the Iranian weapons pipeline. Two posts, two targets, one table.
Meanwhile there’s a conservative commentator somewhere reading the CNN version of Iranian propaganda and telling you Trump surrendered. My brother in Christ, he just set the opening bid for a meeting with Xi Jinping.
Are you paying attention?
Earlier today Ro Khanna was claiming that Trump is a genocidal maniac akin to Hitler.
Now he is claiming that Trump is a cheese eating surrender monkey akin to France.
How do Democrats reconcile such irreconcilable thoughts inside their heads? There are only two possible… https://t.co/trwhpU8Dro
— Cynical Publius (@CynicalPublius) April 8, 2026
explanations: 1. They have zero qualms about lying. 2. They have fully abandoned logic and reason in favor of emotion. Sometimes I feel like Spock gawking at Doctor McCoy.
lead role towards peaceful settlement of the conflict.
🚨 BREAKING: Vessels are being spotted RIGHT NOW going through the Strait of Hormuz after President Trump’s deal
Keep it going!
Trump will hold them to it 🔥 pic.twitter.com/6p8K3qYlk2
— Eric Daugherty (@EricLDaugh) April 8, 2026
White House says reports of Strait of Hormuz closure are false as Iran claims Israel violating ceasefire
As I hypothesized a few weeks ago.
What if the US Navy is in no rush to reopen the Strait of Hormuz? https://t.co/Y8seDssSyq
— John Ʌ Konrad V (@johnkonrad) April 8, 2026
Why do the media take Trump so literally .
It's all in his book The Art of The Deal .
It's called the madman strategy.
Be outlandish, wild and unpredictable, aggressive.
Then give your opponent an escape route to save face
They'll come back to the table .He's ruined their…
— June Slater (@juneslater17) April 8, 2026
their navy, flattened strategic points, caused a partial regime change that won’t be getting any Obama style funding to ‘ regroup’. (Obama sent $130 billion) Israel hasn’t got all its own way either . He’s shown Europe Britain and NATO in up for what they are ,appeasers . He hasn’t caused all this , previous administrations have, he’s just cleaning up the mess!
The entire Iranian theater served one purpose… to cripple The City of London… subduing China was a wonderful byproduct… https://t.co/BHTmeTAuFR
— Observing Consciousness (@holonabove) April 8, 2026
What we learnt tonight is the IRGC can tolerate multiple layers of its ranks getting obliterated but can’t tolerate losing support from China who is its primary supplier for everything that makes the economy run.
That in-turn implies that the real pressure point for the IRGC…
— Just Another Pod Guy (@TMTLongShort) April 8, 2026
is its economic infrastructure and destroying it would be an existential threat for the regime. The logical conclusion is that the IRGC’s internal calculus for its ability to survive an escalation by Trump where he embargo’s trade between Iran-China is far more pessimistic than the prevailing narrative implies. In other words regime change is closer to a coin flip if Trump escalates.
points have already been been agreed to. Thank you for your attention to this matter. President DONALD J. TRUMP
Correct: This goes back the the 'Uranium One' scandal.
Hillary sold uranium from Montana when she was Secretary of State (under Obama) back in 2010 to a Russian firm, which then made its way to Iran. As per plan, no doubt.
This will be forensically proven by the its specific… https://t.co/pFSPFT89A6
— AwakenedOutlaw⚒️ (@AwakenedOutlaw) April 8, 2026
- Now the mask is completely off.
- Multiple international reports now indicate that Iran’s newly installed Supreme Leader, Mojtaba Khamenei, is unconscious and suffering from a severe medical condition, leaving him effectively unable to govern.
- According to a diplomatic memo obtained by The Times, the 56-year-old son of the late Ayatollah Ali Khamenei is lying incapacitated in the city of Qom.
- He is “unable to be involved in any decision-making by the regime,” the assessment states bluntly.
- The Times reported:
Source: thegatewaypundit.com
An interesting report from a Kann journalist:
Israeli attacks on Iranian railway tracks appear to have 'isolated' Tehran from the rest of the country, a step that will help "protesters take to the streets if needed"
10 railway sections have been struckhttps://t.co/OGa6YNek4K pic.twitter.com/ZhOHSTsoN0
— Faytuks News (@Faytuks) April 7, 2026
We are watching a movie.
It is not a coincidence that Trump gave “special credit” to Pakistan Prime Minister Shehbaz Sharif.
Shehbaz Sharif is the BROTHER of Nawaz Sharif.
Nawaz Sharif was a three time prime minister in Pakistan, who was removed three separate times for… https://t.co/xnyzoRjpjN
— JoeLange (@JoeLang51440671) April 7, 2026
Pakistan.
Like Clockwork.
[A]pril
[A]wan
Follow the timeline.
Tick tock…🕔🧐👇😎🐸 https://t.co/70g1Sqvpm4 pic.twitter.com/aq8mPEUYFu
— White Hot Mic (@EDranir) April 7, 2026
[DS] Agenda
BREAKING – NYC voters are shocked as Zohran confirms he will be moving forward with his campaign promise to tax White people at higher rates to help alleviate burdens on black residents.
“The wealth of a White household in the city is $200,000, while that of a black is $20,000.” pic.twitter.com/sS3vL2LMSH
— Right Angle News Network (@Rightanglenews) April 8, 2026
He knows for a fact this can never happen because the justice department will step in and block it as it’s pure discrimination. He is stating this to inflame the population and cause racial division. He doesn’t want NYC to be a great place, he wants rioting, racial division, hatred to show the world democracy doesn’t work.
READ. THE. BILL. BEFORE. YOU. OPEN. YOUR. MOUTH.
Calling the DIGNITY Act “amnesty” isn’t just wrong. It’s a deliberate distortion and it exposes just how little you know about the bill.
This is enforcement first: zero tolerance for criminals, permanent border security, and… https://t.co/mWYBWEbup0
— Rep. María Elvira Salazar (@RepMariaSalazar) April 7, 2026
hard, earned requirements to step forward and face the law, so American workers are protected, not undercut. Amnesty is the chaos you’ve defended, millions in the shadows, no control, no accountability, and a system that stopped working a long time ago. No shortcuts. No giveaways. No blanket forgiveness. That’s law and order. That’s DIGNITY.
So, I did exactly what you asked and I sat down and read ALL 261 pages of your bill.
It does support mass amnesty and I'll tell you exactly where:
Pages 162-170… The Dream Act:
You grant conditional lawful permanent resident status to ILLEGAL ALIENS who:
>Have been…
— Matt Van Swol (@mattvanswol) April 8, 2026
- continuously present in the U.S. since January 1, 2021
- >Entered before age 18
- >Meet education, employment, or military service requirements
- Pass criminal background checks On top of this, in Sec. 2102(b)(3)(B), DACA recipients get fast-tracked to conditional green card status. …which is literally mass amnesty BUT THE BILL GOES EVEN FURTHER!!! On pages 204-217, you present the Dignity Program: This is a separate track for illegal aliens who don’t qualify for the Dream Act.
- If you are an illegal aliens who:
- Was continuously present since December 31, 2020 Pay a $1,000 upfront “restitution” fee >Submit biometrics, pass a background check No felony convictions You get work authorization + travel authorization + deferred removal for 7 years After completing the 7-year program (paying $7,000 total in fees, staying employed, obeying laws, paying back taxes): We grant you:“Dignity Status” which is essentially a lawful nonimmigrant status, which is renewable any number of times Work and travel authorization But the most important bit that you’re hiding here is that it totally suspends deportation of anyone who qualifies for this.
- This would effective end ALL MASS DEPORTATIONS in the United States immediately.
- You are a liar, you are a fraud, everything you stand for is fake… did YOU read your own bill?
- Because I just did, and you are a damned LIAR!!!!!
WOW 🚨 New York City childcare services in AOC’s District is paying $165,333 PER MIGRANT CHILD, PER YEAR
This is more per child than most Americans make in a year
Also in “AOC's District migrant prostitution runs rampant right next to all these daycares” pic.twitter.com/s2nszV7wnr
— Wall Street Apes (@WallStreetApes) April 8, 2026
NJ Democrats Order USPS to IGNORE President Trump’s Election Integrity Mandate
- The Radical Left is in a total panic as President Trump moves to finally secure our nation’s broken and fraud-riddled election system!
- New Jersey Democrats have fired off a letter demanding the United States Postal Service ignore the President’s executive order aimed at stopping non-citizen voting and cleaning up the mail-in ballot chaos that plagued our election.
- The letter, led by far-left Rep. Nellie Pou (D-North Haledon), was signed by the entire New Jersey Democratic congressional delegation – including Senators Cory Booker and Andy Kim, and Reps. Frank Pallone, Donald Norcross, Bonnie Watson Coleman, Josh Gottheimer, Robert Menendez, LaMonica McIver, and Herbert Conaway.
- These Democrats are outraged that Trump is finally doing what he promised: protecting the sacred right to vote for American citizens only.
In their letter to Postmaster General David Steiner, the Dems whine that the executive order is “unlawful” and violates states’ rights under Article I, Section 4 of the Constitution. They demand USPS:
- Refuse to implement any part of Trump’s order that “interferes” with their beloved mail-in ballot machine.
- Publicly reaffirm “neutrality” (code for: keep delivering ballots no questions asked).
- Coordinate only with state officials to protect their rigged system.
- Report back to Congress on any compliance efforts.
Source: thegatewaypundit.com
You need ID to get into the DNC Convention.
You need ID to get into Obama’s Presidential Library.
But voting for who gets to control America’s multi-trillion dollar economy and nuclear weapons arsenal?
No ID.
Because they need fraud to survive. https://t.co/XUKJU8Q59S
— DC_Draino (@DC_Draino) April 7, 2026
What the left plans to do once in power
-Crackdown on social media speech
-Mass amnesty = 30M+ new voters
-End the filibuster + pack SCOTUS
-Nationwide mail-in + no voter ID
-52 states (DC and Puerto Rico)
-Abolish the Electoral College
-MAGA arrests, de-bankingRemember this
— End Wokeness (@EndWokeness) April 8, 2026
President Trump’s Plan
Trump's MAGA media wall collapses https://t.co/x4LOhHGUnC
— Axios (@axios) April 8, 2026
Honestly…. take yourself back to August 2015 through April 2016. Were any of these people "Trump people"?…
[I'll have much more on this later. Been working on data research about this for several weeks.] https://t.co/YFwunsvBtC
— TheLastRefuge (@TheLastRefuge2) April 8, 2026
- Republican Clay Fuller will represent Georgia’s 14th Congressional District in Washington, D.C., for the remainder of the current term.
- Fuller won with about 56% of the vote. Democrat Shawn Harris carried 44% of the vote. The Associated Press called the race after 8 p.m.
- Harris, who ran against former U.S. Rep. Marjorie Taylor Greene twice, inched margins between the two parties much closer. He got just 35% of the vote against Greene in 2024.
Source: gpb.org
NOW – Vance: "'Black-pilling' is how you give power to the forces that are trying to destroy what our ancestors built." pic.twitter.com/WJaL1wGWOw
— Disclose.tv (@disclosetv) April 8, 2026
JD Vance is warning against “black-pilling” — a term from online political culture meaning to become deeply cynical, defeatist, and disengaged because you believe the system is hopeless or that progress is impossible. Vance is pushing a message of strategic patience and sustained engagement instead of fatalistic retreat. It’s a call to keep building and fighting for what you value rather than surrendering the field to those who want to tear it down.
Better times at the White House. pic.twitter.com/MwehF2SjTl
— Democrats (@TheDemocrats) April 4, 2026
Icons. 🐰 pic.twitter.com/z28ICtt3EA
— The White House (@WhiteHouse) April 6, 2026
TRUST TRUMP.
NOT PANICANS. pic.twitter.com/VajCJNJNU4
— Trump War Room (@TrumpWarRoom) April 8, 2026